Drawn once in 1967, drawn every Monday now
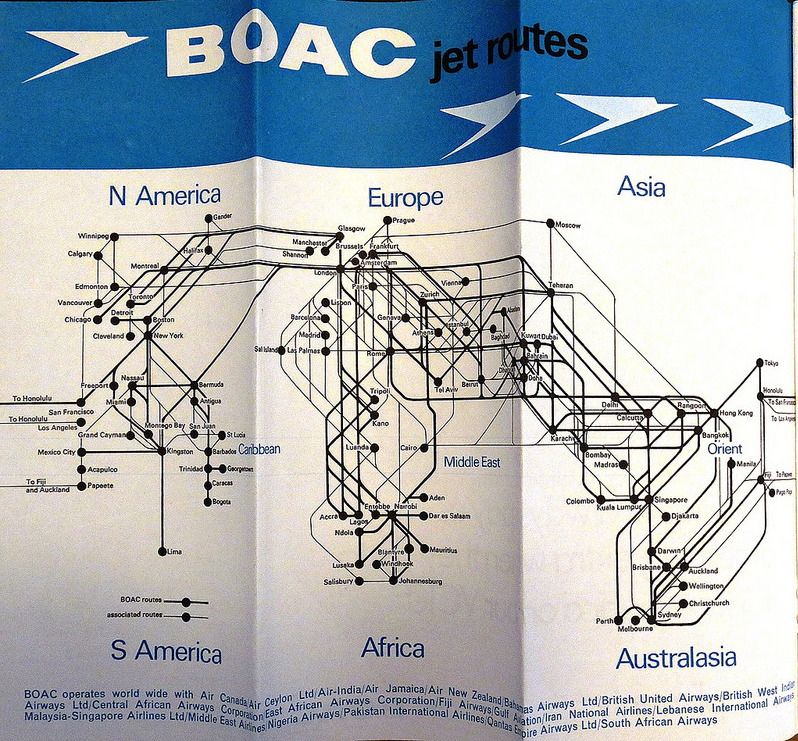
BOAC jet routes, 1 September 1967 timetable. Photo: mpar21 on Flickr.
Almost sixty years ago someone at BOAC sat down and drew this. It is the jet routes map from the timetable of 1 September 1967, the year the airline flew 47 aircraft: 21 VC10s, 21 Boeing 707s and five Comet 4s. BOAC was Britain's state-owned long-haul carrier, BEA its domestic and European twin. The two merged into British Airways in 1974, and you can see the root of every BA route map since in this one sheet.
What the 1967 drawing gets right
There is no map underneath it. The continents are a faint suggestion, Europe and Africa, the Americas, Asia, and after a few seconds you stop noticing them. The lines are the picture. Every line leaves London on a straight run, bundled with its neighbours, and turns through 45 degrees into its city. Where a line would pass behind a name, the name wins: the type sits in a small cream knockout and the line goes under it. Regions are words, not shapes. Two line weights tell BOAC's own routes from its partners'. Nothing is decorated.
Most of all, it is one drawing. One fleet, one timetable, one designer, with a whole summer to nudge Zurich a touch to the right so the Rome line clears it. When a label collided with a line, a human moved the label.
What we borrowed
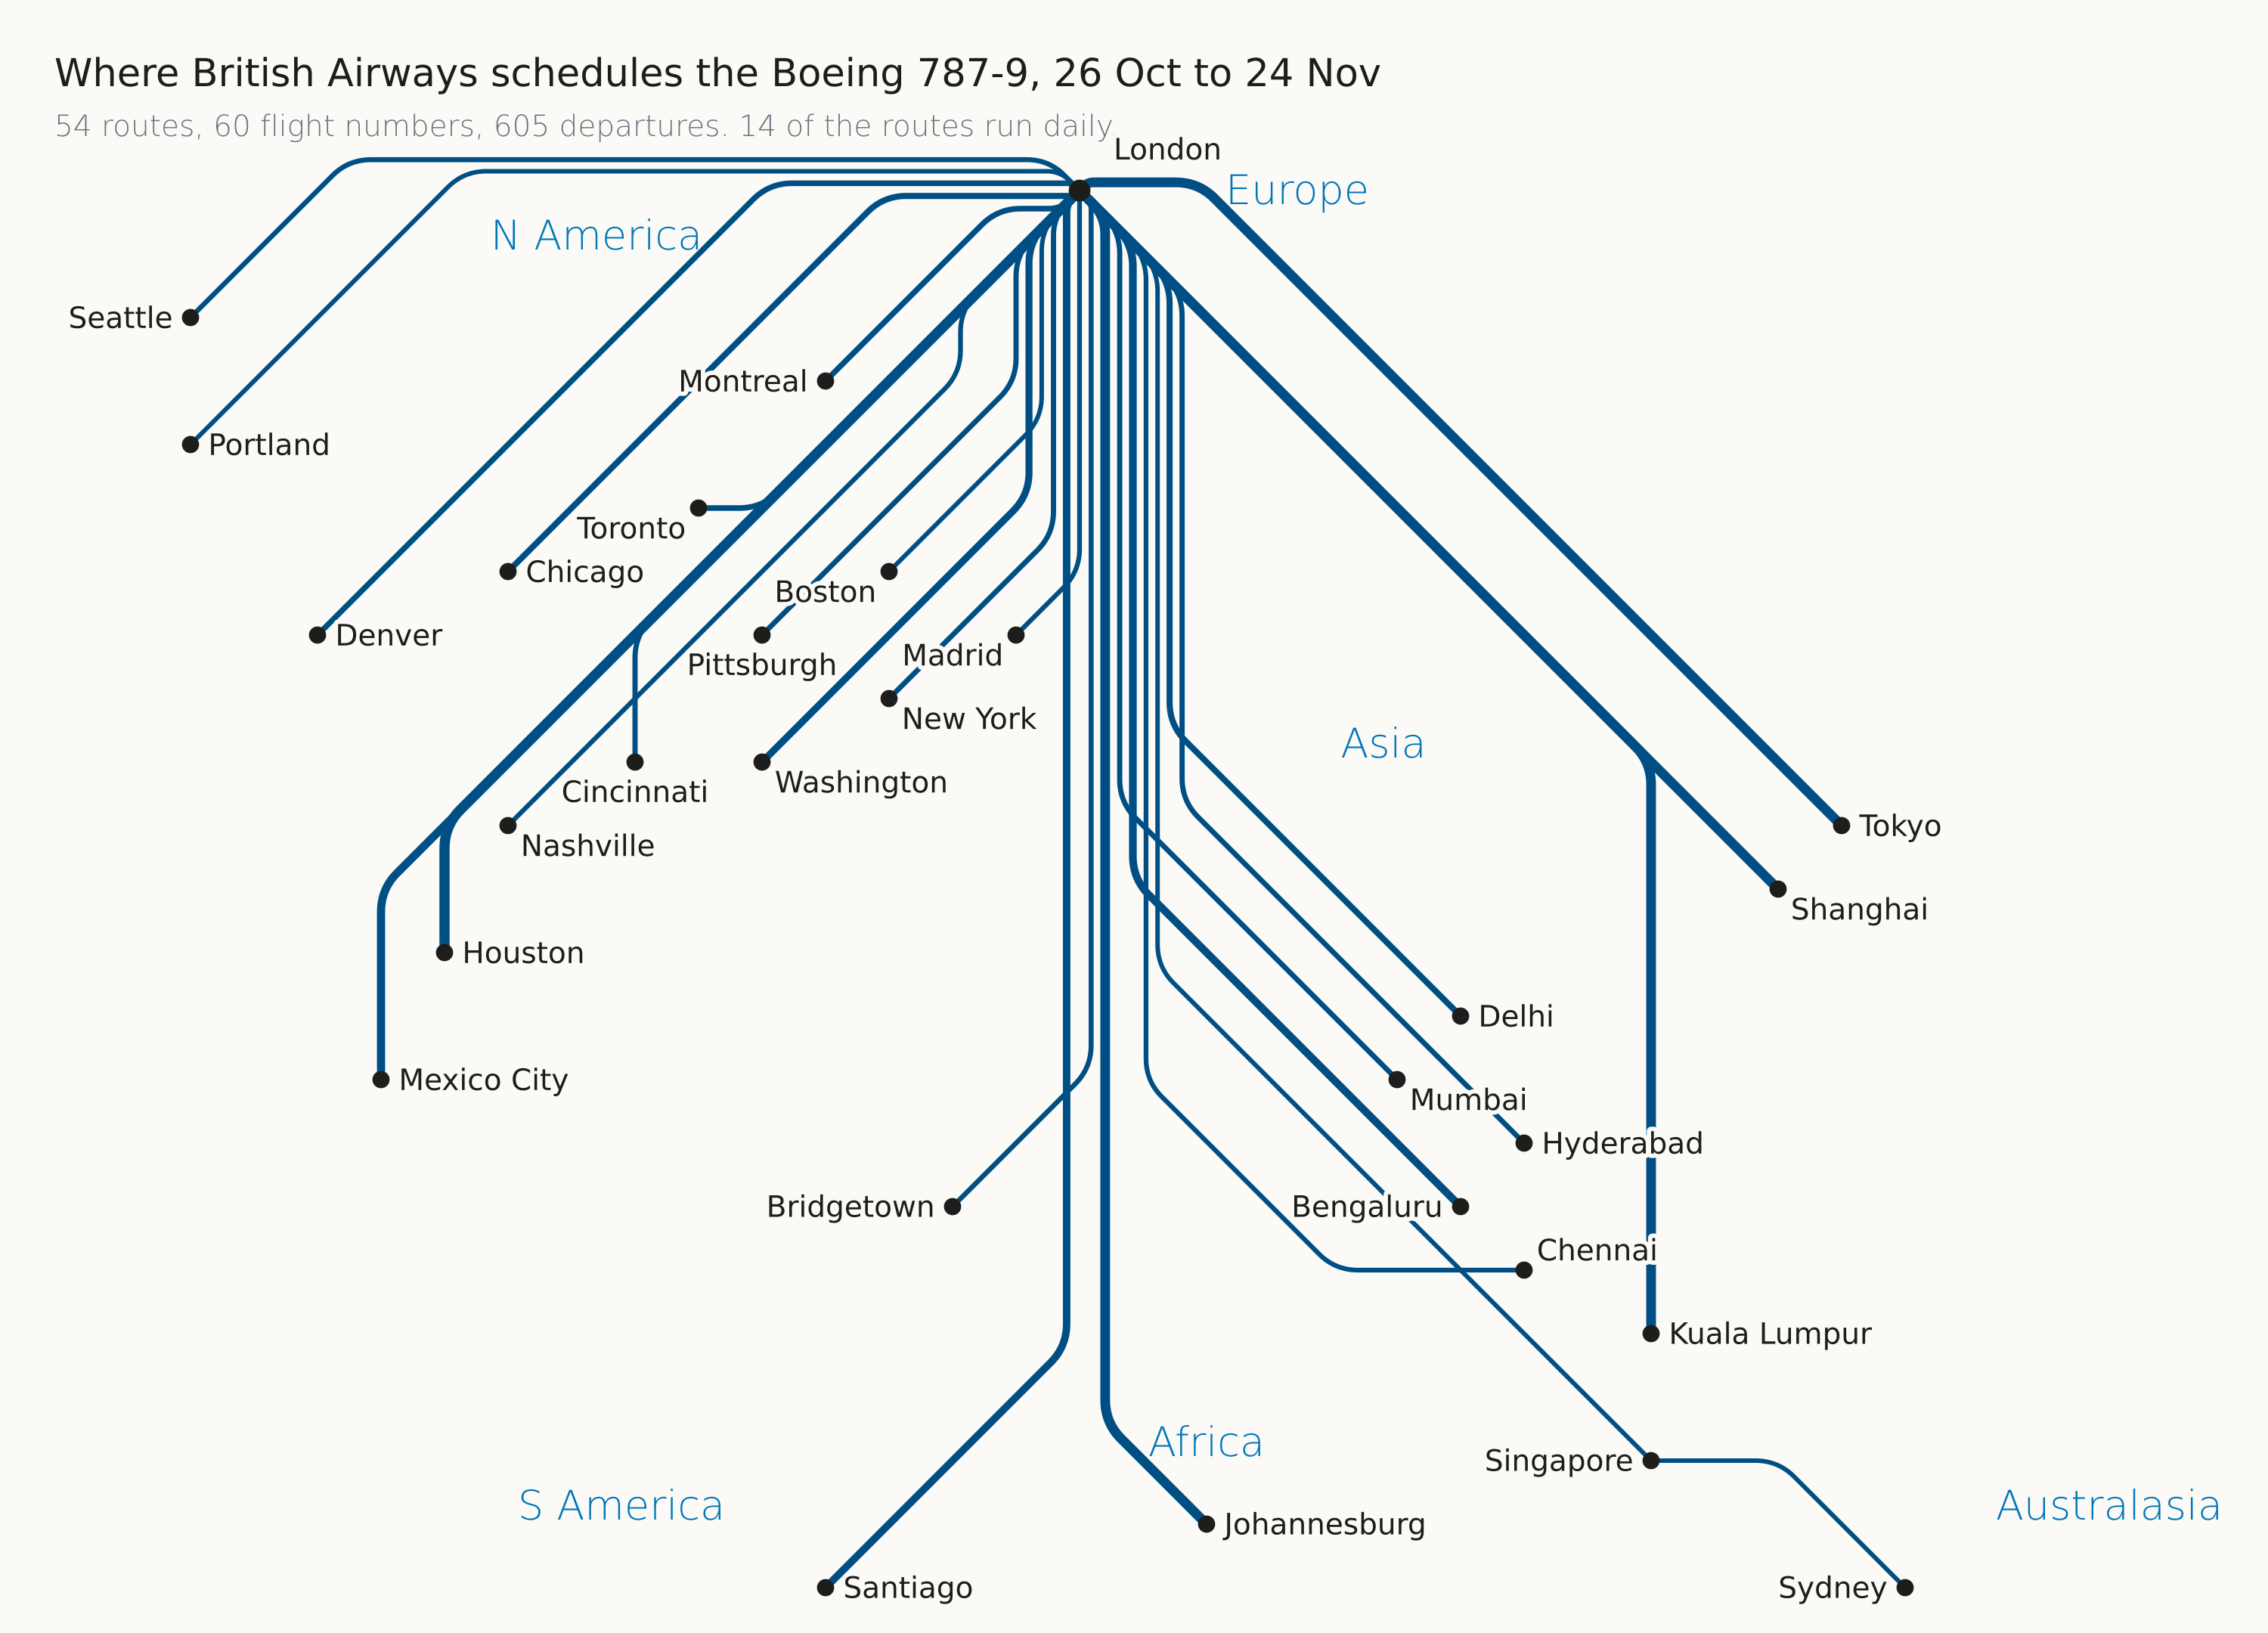
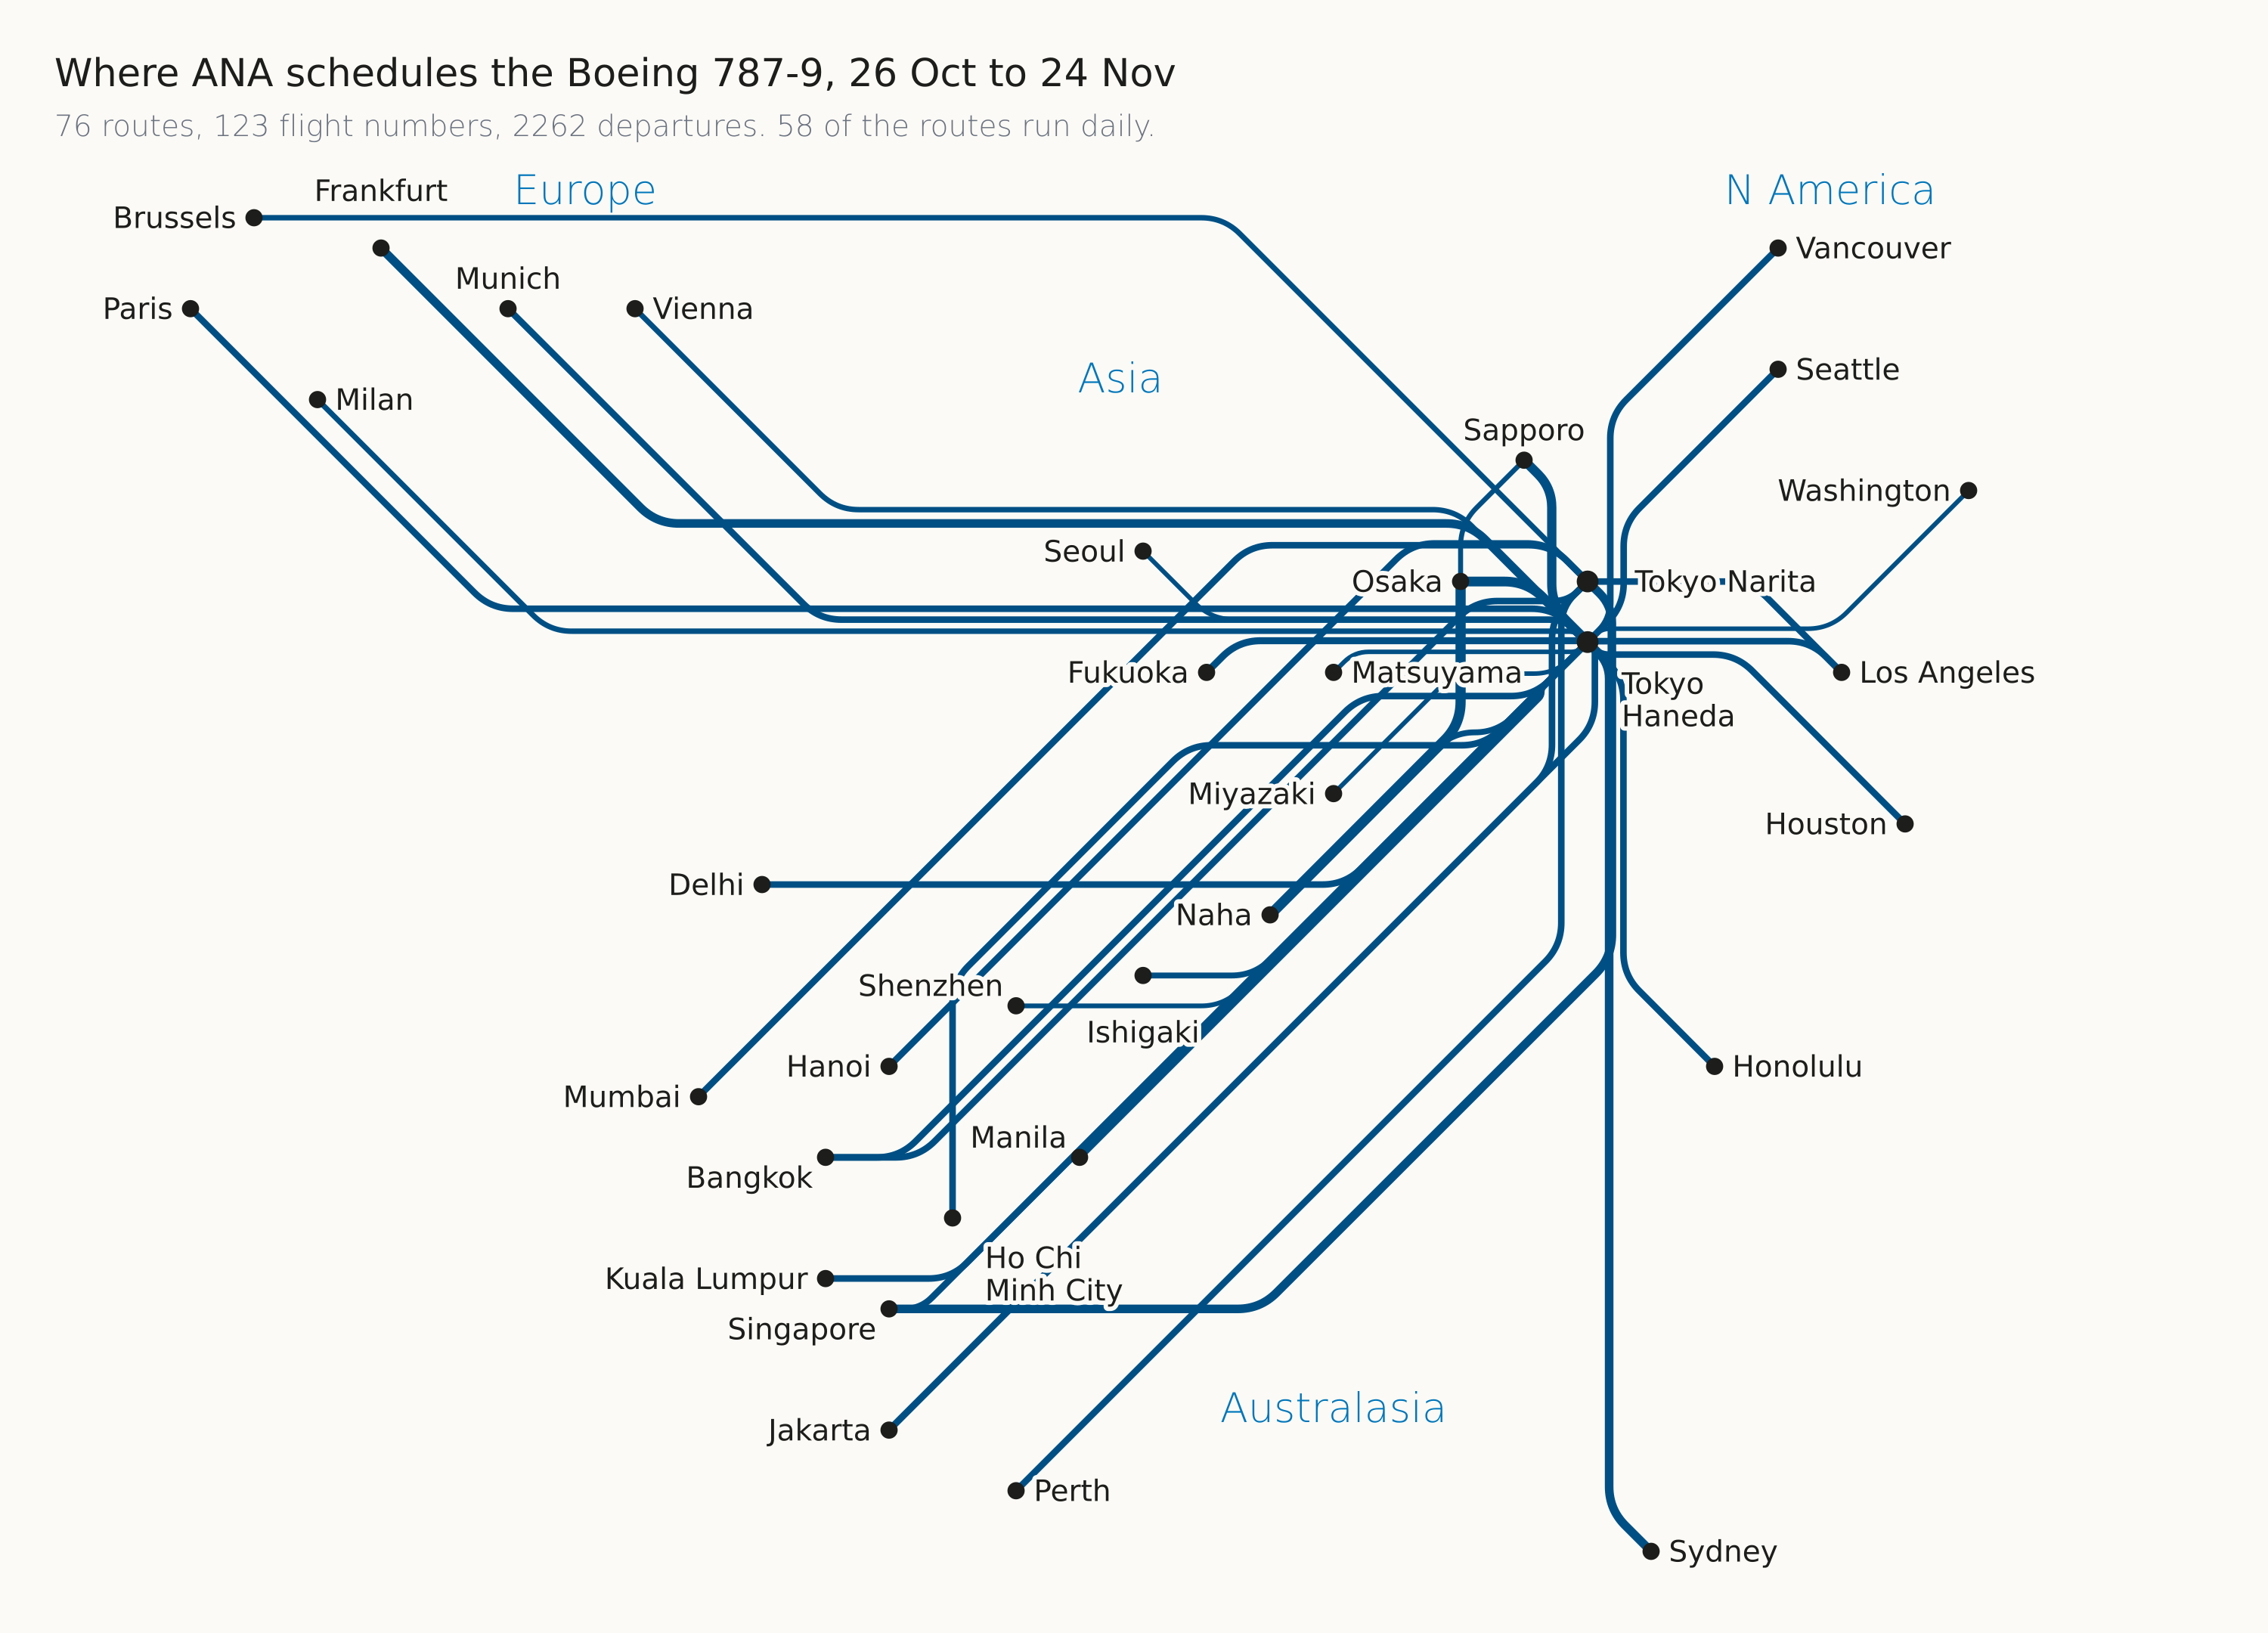
When we started the route pages, where each airline schedules each aircraft type over the next 30 days, the team passed round a handful of these old maps for inspiration. The BOAC one set the rules: no land, one colour, line weight by how often the route flies, region names as words, labels in a knockout the colour of the plate.
Why hundreds of maps is a different problem
The BOAC designer drew one map. We draw 765 of them, one for every airline and aircraft type pairing in the schedule, and we redraw them every week when the OAG schedule moves. Nobody looks at most of them before they are published. So the summer of nudging had to become a set of rules an engine can apply, blind, to any network from four routes to eighty.
- Cities snap to a grid and push each other apart until every pair has clear space. A city's position is a blend of where it is and where it ranks east to west, so a crowded cluster opens up and an empty ocean shrinks.
- Two airports of one city stay neighbours. An early version dealt Newark and JFK a whole rank apart, and the result read as a different Newark.
- Every route leaves its hub on a straight trunk, one lane per route, lanes ordered by bearing so branches peel off in order and never cross. Houston's Sydney and Sao Paulo lines crossed until we fixed which side of the trunk a southbound branch takes.
- A line never runs through another city's dot. Chicago to Rome has to get past Nice and Madrid, so a route carries fallbacks: a straight approach, then a 45 degree leg, then a dog-leg along the city's own column as a last resort.
- Names look for clear space around their dot, eight directions at two distances, busiest city first. Region names go above their cluster: Africa printed under Cape Town on a phone reads as somewhere else.
- Where a plate has two airports with one city name, the airport name comes from our database and the diagram says Haneda and Narita, Heathrow and Gatwick.
- Past about eighty city pairs, one diagram is a knot. The page draws nothing and lets the table carry the routes rather than print something unreadable.
The same engine draws the map on aerolopa.com and in the AeroLOPA app, so a route looks the same on a phone as on a desk.